About the Dashboard
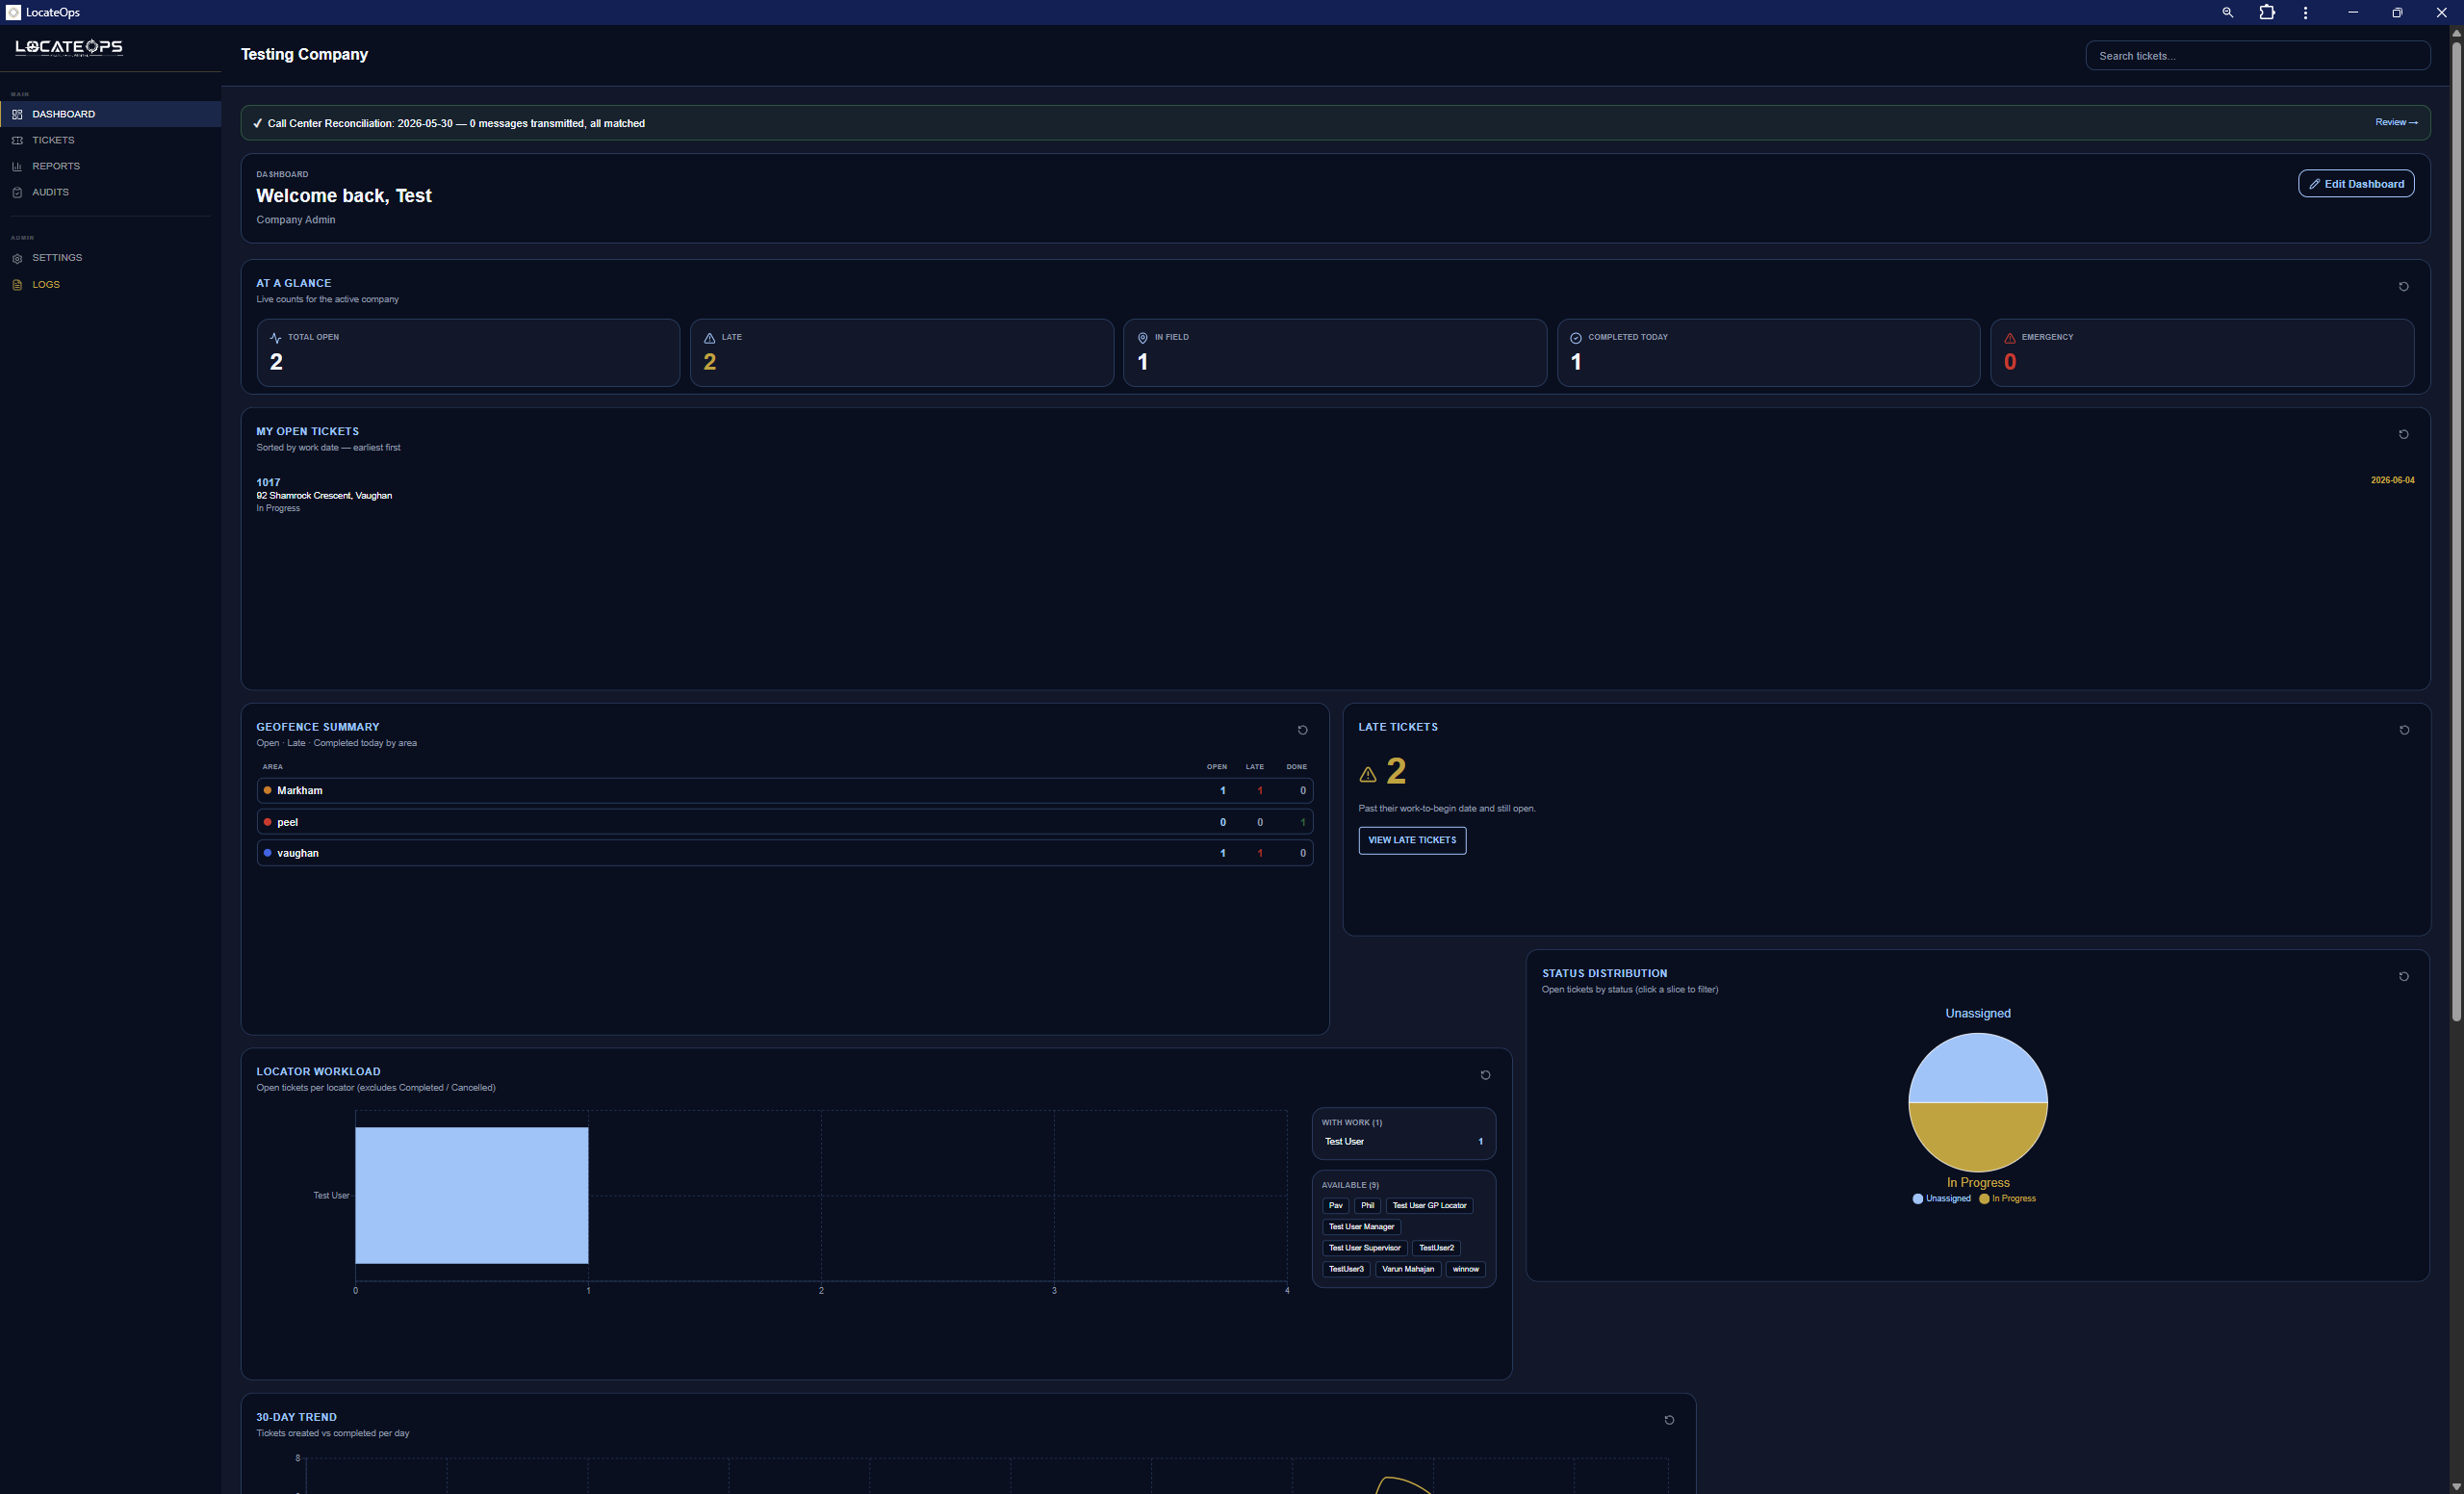
The Dashboard is the first thing you see when you sign in. It's a role-aware summary — it shows the widgets that matter for your job, from a locator's open-tickets list to a manager's company-wide trends. This guide explains what you'll see, how to read it, and how to arrange it to suit you.
Out of the box the dashboard adapts to your role automatically: a locator sees a focused, personal view; a supervisor or manager sees the bigger picture. You can then customise the layout — rearrange, resize, and hide widgets — and your arrangement is saved just for you. The sections below describe every widget and banner you might encounter, and how to make the dashboard your own.
Banners
Banners appear across the top of the dashboard to flag things that need attention. The most important is the Call Center Reconciliation banner.
Call Center Reconciliation banner
This banner reflects the latest nightly digest from the call centre — the record of what it transmitted to you. It has four states:
| State | Colour | Meaning |
|---|---|---|
| All matched | Subtle / green | The latest report arrived and everything it lists is in LocateOps. Nothing to do. |
| Missing locates | Amber | The call centre says it sent locates you don't have. Investigate them in Reports → Call Center Reconciliation. |
| No report today | Amber | No digest arrived today past the expected time — possibly an upstream issue at the call centre. |
| (hidden) | — | No reports yet, or you don't have permission — the banner simply doesn't appear. |

An amber missing locates banner is the one to act on. It can mean a locate the call centre sent never made it to your team. Open Reports → Call Center Reconciliation to see which ones and investigate. See the Reports guide.
The same reconciliation information drives a nightly digest email to people with the right permission, so missing locates get flagged even when nobody is looking at the dashboard.
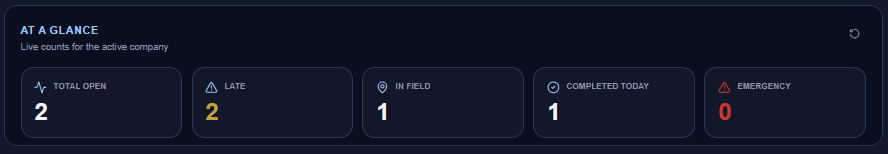
The Stats Strip
At the top of every dashboard is the At a Glance strip — four summary cards. What they count depends on your role: a locator sees their own numbers (their open and completed work); a manager sees company-wide totals.
Widgets by Role
Below the stats strip, the dashboard shows widgets chosen for your role. You'll see a subset of the following.
My Open Tickets (everyone)
Your assigned tickets that aren't finished, sorted so the most urgent (by work-to-begin date) are at the top. Your daily to-do list. Click any to open it.
Locator Workload (dispatchers & up)
A bar chart of how many open tickets each locator is carrying, plus a list of available locators. Use it to balance assignments. Clicking a locator jumps to their tickets.
Status Distribution (dispatchers & up)
A pie of open tickets by status. Click a slice to jump to the board filtered to that status.
Late Tickets (dispatchers & up)
A count of tickets past their work-to-begin date and not yet completed — the fire-drill number. Keep this low.
Recent Activity (where permitted)
The last several actions across your tickets — a quick pulse of what's happening.
30-Day Trend (supervisors & managers)
Created vs completed tickets over the last 30 days. Shows whether you're keeping pace with incoming work or falling behind.
Geofence Summary (where you have geofences)
If your company uses geofences and you can see some, this widget breaks down work by area — Open, Late, and Completed-Today counts per geofence, each linking straight to the board filtered to that area. It appears automatically when you have geofences to show; see the Geofencing guide.
Locators and lead hands get a focused view (stats + their open tickets). Dispatchers add workload, status, late, and activity. Supervisors and managers add the 30-day trend. Auditors see a streamlined view focused on their work. Whatever set you start with, you can rearrange or hide it — see below.
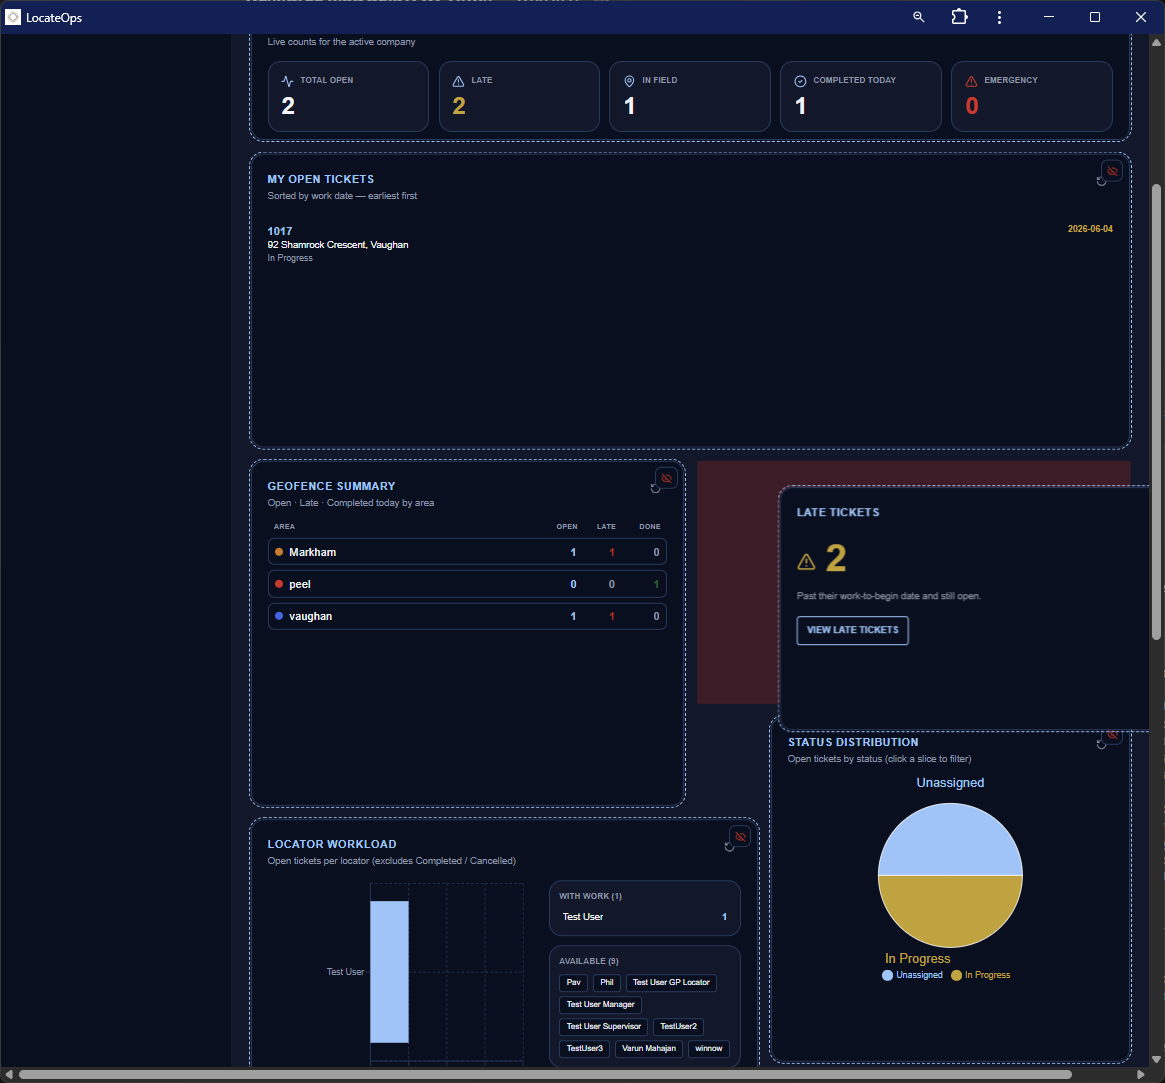
Customising Your Dashboard
The dashboard isn't fixed. You can drag widgets around, resize them, and hide the ones you don't use — and your layout is remembered for next time, just for you.
Entering edit mode
Click Edit Dashboard in the dashboard header. The widgets become movable, and Save / Cancel controls appear. Nothing you do is permanent until you click Save — Cancel throws away your changes and puts everything back.
Rearranging and resizing
- On desktop — drag a widget by its header to move it, and drag its edge/corner to resize it within the grid.
- On a phone — drag to reorder widgets up and down. (Resizing is desktop-only — a phone shows one column, so there's nothing to resize.)
Hiding and restoring widgets
- In edit mode, click the eye-off button on any widget to hide it.
- Hidden widgets collect in a Hidden widgets row — click one to bring it back.
- Click Save to keep your arrangement, or Reset to return to the standard layout for your role.
Your layout is saved to your account, so it follows you to any device you sign in on, and it's independent of your teammates' — rearranging your dashboard never changes anyone else's.
If a new widget ships after you've customised your dashboard, it's added to the bottom automatically — you won't miss it, and your existing arrangement is preserved.
Quick Actions & Shortcuts
The dashboard is also a jumping-off point. The widgets are clickable shortcuts:
- My Open Tickets rows → open that ticket.
- Status pie slices → the board, filtered to that status.
- Locator Workload entries → that locator's tickets.
- Late Tickets → the late queue.
- Geofence Summary rows → the board, filtered to that area.
Rather than navigating to the board and filtering, click straight from the dashboard widget — it lands you on the filtered view in one step.
Reading the Metrics — A Worked Example
Suppose a dispatcher's dashboard shows:
- At a Glance: 42 open, 8 unassigned, 5 late, 12 completed today.
- Late Tickets: 5.
- Locator Workload: one locator with 15, others with 3–4.
How to read it: there are 8 tickets nobody owns — assign those first. 5 are already late — triage those today. And one locator is badly overloaded at 15 while others are light — rebalance. The dashboard surfaced three concrete actions in one glance.
On Mobile
The mobile dashboard shows the same role-aware widgets, stacked for a phone screen. Locators — who live on mobile — get their personal stats and open-tickets list front and centre, with the reconciliation banner at the top when it applies. You can reorder widgets in edit mode on mobile too.
Common Scenarios
“There's an amber banner at the top.”
It's the Call Center Reconciliation banner. Amber means either missing locates (investigate in Reports) or no digest received today. Read the banner text and act accordingly.
“My dashboard looks different from my coworker's.”
That's expected — the dashboard adapts to each person's role, and each person can rearrange or hide widgets. A manager sees more widgets than a locator, and your custom layout is yours alone.
“I hid a widget and want it back.”
Click Edit Dashboard, find it in the Hidden widgets row, click to restore it, and Save. Or click Reset to return to the standard layout for your role.
“I want to see all the late tickets.”
Click the Late Tickets widget (or the Late quick view on the board).
Gotchas & Tips
Act on the amber reconciliation banner — it can mean a missed locate.
The dashboard is role-aware — different roles start with different widgets by design.
Your custom layout is personal and saved — it won't affect teammates, and Cancel/Reset always get you back.
Click the widgets — they're shortcuts to filtered views, not just numbers.
Watch Late Tickets and Unassigned — those two numbers drive your daily triage.
Can't find what you need? We respond personally to every message.